You all know what extrapolation is: you measure some effect in the range of data that you have, and you presume that it will continue to operate in a range of data that you don’t have.
All of us extrapolate, but we also know that we should be careful because it can get us into trouble. For example, if we extrapolated Stephen Curry’s shooting, we might claim in a few years he’ll be hitting mostly 80 footers. He’s good, but not that good.
Anyway, this has come up in a couple of contexts in lecture, so I figured I’d lay them out for you.
One of those is Galbraith’s support of Sanders. It’s basically that Sanders is projecting bigger results because he’s making bigger proposals. That’s an extrapolation because Sanders is making proposals of a size about which we have very little experience. Just because it’s an extrapolation doesn’t make it wrong, but it should signal you to be extra careful.
The same thing has also happened with the large minimum wage increases that have been proposed nationwide. There is some empirical evidence that labor demand is inelastic with respect to the minimum wage (see below). This makes the typical theoretical complaint that minimum wage increases cause job losses into a weak counterargument. The thing is, all the evidence showing this is drawn from modest increases in the minumum wage of something like 10%. It’s an extrapolation to presume that if we increase the minimum wage by 100% — which is the amount under discussion in many places — that we will get the same behavior.
I mention the Challenger Disaster because it’s the best known example of extrapolation gone wrong. Challenger was the space shuttle that blew up after launch in 1986. It blew up because it was launched on a cold day, some rubber o-rings shrank in the cold, and hot combustion gases blew threw the resulting gaps until they burned through other critical parts.
The thing is, rubber parts shrinking in the cold is to be expected, so the engineers had been measuring o-ring damage versus launch temperature for a while. The measurements of all flights before the crash are the points on the right. The temperature for the Challenger launch is the gray bar on the left. Managers extrapolated the large number of launches with no damage at all to assert that it was safe to launch on such a cold day. To do this, they had to dismiss as outliers the four points in the middle showing that on the coldest extent launches they always observed damage, and further that it was negatively associated with temperature.

This chart is part of the discussion of poor decision-making due to bad graphics in Edward Tufte’s (no relation) treatment of the Challenger disaster in his book Visual Explanations, pages 38 – 53.
**********************************************************************
About that minimum wage evidence. Check out this chart. Menzie Chen posted this at EconBrowser. It shows all published estimates of the elasticity of labor with respect to wage changes. This is called a funnel graph: points toward the top are more accuate than those below them.
Most of the estimates are negative: increasing wages decreases labor demand. That’s the sensible theory you hear in micro. But note that quite a few of them are positive too: that’s the more newfangled idea that labor markets are a bit goofy, and minimum wage increases might actually be beneficial. The red line seems like a reasonable guess at the true effect: an elasticity of –0.2. Values that close to zero mean that labor demand is about as responsive to wage increases as smokers are to cigarette price increases — not very. If you work out the math it means that a 5% job loss would be associated with a 25% increase in the minimum wage (that the other 95% would get). These results tend to support the Democratic position strongly. Having said that, I’d be pretty leery of any increase larger than the 10% or so that the studies were based on: if that turns out OK, we can repeat it.
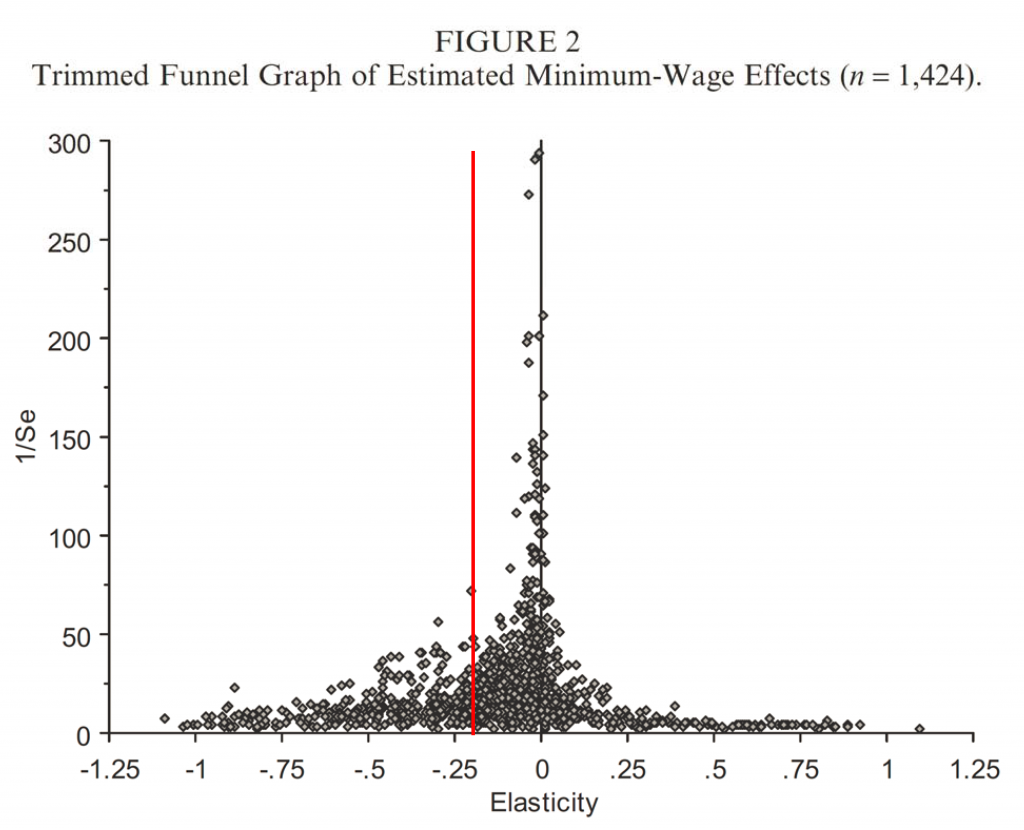
Figure 2 from Doucouliagos, Hristos, and Tom D. Stanley. “Publication Selection Bias in Minimum-Wage Research? A Meta-Regression Analysis.” British Journal of Industrial Relations 47.2 (2009): 406-428. [ungated working paper version], with red line drawn in at elasticity = -0.2.
No comments:
Post a Comment