Political Calculations provides this chart:
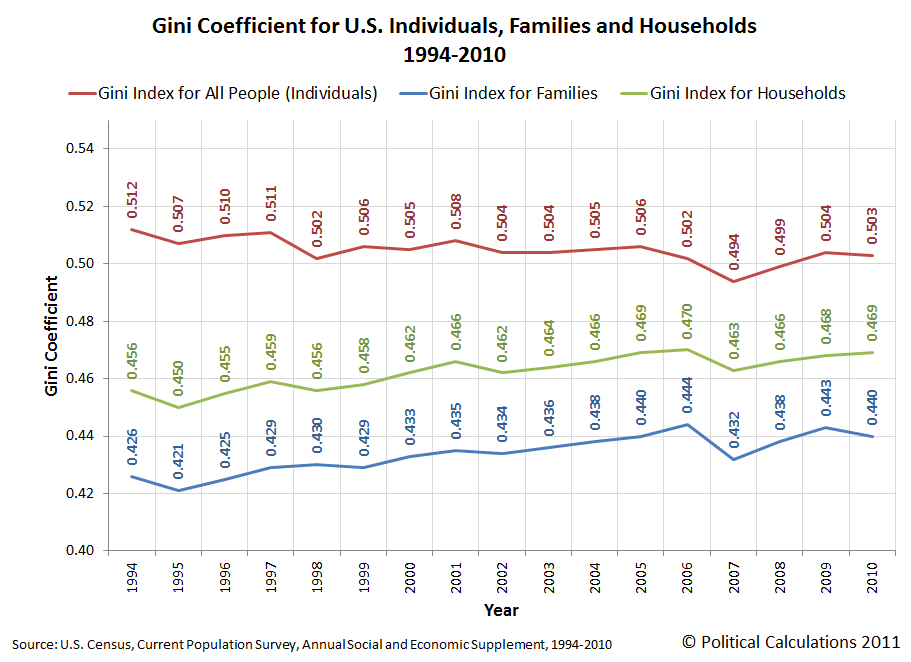
It shows inequality as measured by the Gini coefficient for the U.S. Higher is more unequal.
Individuals tend to have far more unequal income than families or households. This is just measuring the obvious truth that one of the reasons for forming families or households is so that individual income can be more unequal: this is what it means to care for someone young, old, or disabled. So, the red line should be at the top. By the same token, households should be more unequal than families because families tend to be more likely to be caring for the young, old, and disabled.
Now, look at the trends. Individual income inequality is improving, family and household inequality is getting worse. How can that be so?
What you’re seeing here is that inequality is about how people form households and families. The people getting paid are more equal than before, but the households and families they live in are more unequal. The reason for this is the agglomeration of richer people together and poorer people together … not the winner-take-all society.
No comments:
Post a Comment